Windows Server Monitoring
PRTG’s professional all-in-one Windows Server monitoring solution
- PRTG uses WMI, performance counters, and SNMP
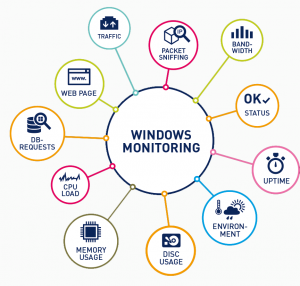
- PRTG monitors CPU, memory, traffic and uptime
- Windows Event Log Monitoring
- Windows Security Monitoring
- Custom sensors for individual needs
Windows Monitoring Software –
5 advantages of PRTG
COMPLETE MONITORING SOLUTION
PRTG provides an overview of your entire network. Our software monitors the database, mail, Internet and virtual servers. CPU, memory, disk space, traffic, uptime and more: PRTG is a comprehensive solution that frees you from unnecessary worries. It also includes alerting and reporting features.
TECHNOLOGY
PRTG uses a variety of technologies to perform Windows server monitoring. These technologies include Windows Management Instrumentation (WMI) and Windows performance counters. Alternatively, you can also use SNMP, which creates significantly lower loads. We also offer packet analysis sensors and NetFlow for detailed monitoring of individual data sets.
INDIVIDUALLY CUSTOMIZABLE
In a Windows environment, you can monitor countless settings. When specific problems arise, administrators need customizable monitoring software. PrTG comes with several custom sensors that you can customize to suit your specific needs. And that means you’ll get to the bottom of the problems quickly.
MONITORING THE WINDOWS EVENT LOG
PRTG analyzes Windows event log files by default and without fuss. Among other things, the event log files include the Application logs and the System log. When an error occurs in the Windows operating system, a special PRTG sensor immediately beeps so that you can correct it.
WINDOWS SECURITY MONITORING
Security-related data (such as the status of your antivirus software) is displayed in Windows Security Center. PRTG takes this data and integrates it into your monitoring view. Thus, you get constant monitoring through the control panel. Thanks to the PRTG app, you can even keep an eye on the parameters while on the go.
Using a different tool? Why you should switch to using PRTG:
CENTRALIZED TOOL
PRTG is a comprehensive monitoring tool that covers all your monitoring needs. You get a global overview of your system, available around the clock and seven days a week. Do away with the need to manipulate various specialized tools that offer only isolated solutions and waste precious time.
FIELD-PROVEN SOLUTIONS
PAESSLER AG relies on an experienced development team fully focused on the development of PRTG. Thanks to PRTG, you will be able to take advantage of solutions that have been developed for several years. Gone are the days when you had to constantly program new interfaces yourself – all this has already been done for you!
EASY CONFIGURATION
PrTG’s automatic detection function facilitates configuration. During setup, simply specify a range of IP addresses and PRTG will search for available devices and apply predefined sensors. This means you can start with some initial monitoring when you first run the software.
Seven Sensors for Windows Server Monitoring
The PRTG comes with predefined sensors to monitor common parameters such as CPU, memory, and network card. We also offer a number of useful sensors that you can configure yourself.
- WMI Event Log Sensor: This sensor reads the Windows Event Log and provides easy-to-understand visual data.
- Event Log (Windows API) Sensor: This sensor uses the Windows Application Programming Interface (API).
- WMI Security Center Sensor: This sensor monitors any product that can be inspected by Windows Security Center.
- PerfCounter Custom Sensor: This sensor monitors an individually trained set of Windows performance counters.
- WMI Custom Sensor: This sensor uses WMI to execute a single WQL query and tracks the subsequent return value.
- Windows Process Sensor: This sensor monitors the Windows process using performance counters or WMI.
- REST Custom Sensor: This sensor monitors the availability of the RESTful API, automatically recognizes the contents of XML and JSON files, and creates suitable channels for values.
PRTG System Information Feature for Windows
The system information feature is available for each Windows device configured in PRTG. An additional tab displays information about your Windows system, such as its IP address, installed hardware, and running software. Current processes are also listed here.
Paessler Study on WMI Network Monitoring
Paessler AG recommends the use of SNMP for day-to-day monitoring of Windows servers, as this technology creates extremely low loads. Two other features are performance counters and WMI. Administrators should not create more than 200 WMI sensors for each probe, as otherwise performance will suffer greatly.
WMI is the Windows standard for network monitoring. Paessler AG periodically performs tests to offer advice on the use of WMI. PRTG monitoring should work efficiently and smoothly. One of our major studies was conducted in 2012. The most important results are:
For a primary PRTG server configuration, Windows Server 2008 R2 2012 is best suited for rapid WMI monitoring. The more modern Windows Server 2012 R2 has proven to be just as effective and is also our general choice for PRTG configurations.
According to a 2012 study, you should choose Windows Server 2008 R2 for client systems (if possible). Newer versions, such as Windows Server 2012 R2, Windows 8.1, Windows 10, and Windows Server 2016, also work well with WMI.