PRTG: Comprehensive Uptime Monitoring
- PRTG monitors the uptime of servers: FTP server, DNS, SQL, mail server, virtual servers
- PRTG tracks the availability of your website
- Determines the causes of failures
 Provides comprehensive reports with graphs, statistics
Definition: Uptime in Network Infrastructure
The term “uptime” is used in IT to refer to the period of time when a system is functional and accessible. Applied to a network, an uptime is defined by the period when servers and devices, domains, and websites are available to users. Availability is expressed as a percentage. 90% availability during the day means that the system was operational that day and was available for 1296 minutes (21.6 hours).
Uptime monitoring helps maintain IT infrastructure availability
The purpose of monitoring the PRTG uptime is to guarantee the smooth operation of the network. Hardware, servers, CDNs or websites – you should monitor the availability of all elements of your IT infrastructure.
If one of the services goes out of service, you’ll receive an instant message via email, SMS, or push notification and can quickly take action to prevent a major system crash. Of course, your task, as an administrator, is to keep the uptime value as close to 100% as possible. PRTG will provide you with detailed statistics on the period of network operation and service availability.
Uptime Monitoring: Why PRTG Is a Good Choice
UNIFIED MONITORING
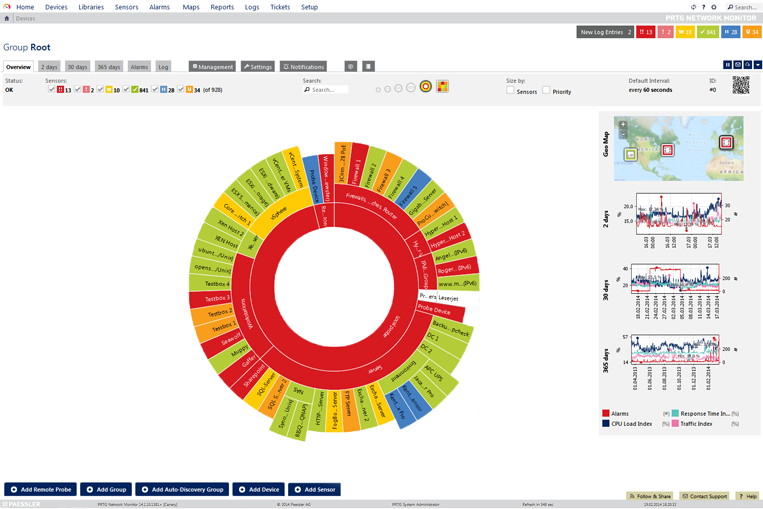
In many companies, administrators use multiple monitoring tools to monitor the performance of different systems. Controlling monitoring results from several separate tools takes a long time. Add to this the need to perform other internal tasks and get a recipe for creating chaos, sooner or later this can lead to accidents. PRTG is a single, centralized, end-to-end monitoring solution for the entire infrastructure. PRTG is easy to install, doesn’t clog traffic, and simplifies your work.
FIND THE CAUSE OF FAILURES
PRTG will provide you with a comprehensive overview of your entire IT infrastructure. It not only tracks the uptime and downtime of the system, but also identifies the causes. What really caused the failure? Hardware, network connection, or incorrect settings? With PRTG, you’ll save time on troubleshooting.
TIMELY ALERTS
A customizable notification system promptly sends out alerts, and you can fix errors before serious failures occur. Do not wait to extinguish the fire, prevent its occurrence!
DETAILED REPORTS
PRTG has a comprehensive reporting system with statistics, graphs and other elements. Create your own reports. Set up automatic distribution of reports to your management. Use reports to find opportunities to optimize resources.
COMPATIBILITY WITH THIRD-PARTY SOLUTIONS
PRTG produces monitoring sensors for almost all major IT vendors, including Cisco, Dell, Oracle and HP.
FULL CONTROL OF THE SITUATION
Monitoring with PRTG gives you complete control. Take advantage of reliable monitoring data to optimize network load. Or use data when you plan to expand your network.
Your goal: get closer to 100% uptime
When it comes to uptime rates, even one percent counts: 99,999! These five nines are a sign of the high availability of your network. PRTG helps to achieve ambitious uptime targets. On this page you will learn about the benefits of uptime monitoring with PRTG, our sensors and get some monitoring tips!
Uptime measurement: track the performance of all devices on the network
|
UPTIME OF YOUR SERVERS |
DEVICE UPTIME |
UPTIME OF WEB SITES |
| With PRTG you can check the uptime of all your servers. Whether it’s an FTP server, a mail server, a web server like IIS, a DNS server, a SQL server, or virtual servers like VMware or Hyper-V– PRTG keeps track of everything. CPU usage, memory, bandwidth, and other settings are monitored by default. For more information, see the Server Availability page. | After employees complain about the malfunction of devices, administrators proceed to a time-consuming search for the cause of the failure. Is the cause of an error on the network or on the user’s device? With PRTG, you can check the availability of each individual device – whether it’s a desktop, a router, a switch, or another network component. To learn more, visit our PRTG Equipment Monitoring page. | In many companies, the availability of a website affects sales. Every second when a company is offline due to a site crash is a second when customers can’t browse products or place orders. With PRTG, you’ll be able to control the availability, speed and performance of the database, as well as the content on your website. When it comes to domain availability, the issues are often the same. |
Sensors for monitoring system uptime
Ping Sensor: The easiest way to check the uptime or availability of your network is to use the Ping Sensor. For more information about the Ping sensor, see the PRTG guide.
SNMP System Uptime Sensor: This ready-made sensor will allow you to monitor the uptime via SNMP and see how long the device is running without interruption. SNMP does not exert a heavy load on the network and processor and is thus a good monitoring solution. Learn more about SNMP System Uptime Sensor.
Windows System Uptime Sensor: The sensor allows you to monitor uptime through Windows Performance Counters or Windows Management Instrumentation (WMI). For more information, see Windows System Uptime Sensor. This sensor is ideal for Windows devices, it tends to reduce the performance of your system, unlike SNMP.
Other sensors: Our list includes more than 200 ready-made sensors. Sensors for servers, traffic, applications … the selection is extensive and constantly updated by the PAESSLER team.
Use the Smart Setup Wizard! PRTG automatically starts creating sensors from the moment the solution is configured. PRTG pings the IP range and allows you to start monitoring the uptime as soon as you first start our solution.