End-to-end WMI monitoring solution
- PRTG monitors the status of servers and workstations using WMI tools
- Provides many sensors for Monitoring Windows, including sensors for performance counters and for WMI
- Uses SNMP and other technologies
Why use WMI monitoring?
WMI monitoring captures detailed information about the status of servers and workstations running Windows. With WMI, you get access to Windows system performance and configurations. WMI is used to monitor the operation of Active Directory, SharePoint, or SQL database. PRTG’s WMI monitoring solution collects traffic, memory usage, or disk space. If one of the devices exceeds the allowed values, you can create a query yourself and track the returned values.
What is WMI monitoring?
WMI (Windows Management Instrumentation) is a set of tools from Microsoft that allows you to monitor the status of Windows workstations and servers. WMI displays the performance of the operating system, the status of processes, services, and the file system. WMI uses the Distributed Component Object Model (DCOM) protocol. Since 2000, WMI has been built into all Windows operating systems.
WMI monitoring is a technology for monitoring Windows servers and workstations. Does not require the installation of agents. With WMI monitoring, an administrator monitors the performance of Windows servers or applications in real time.
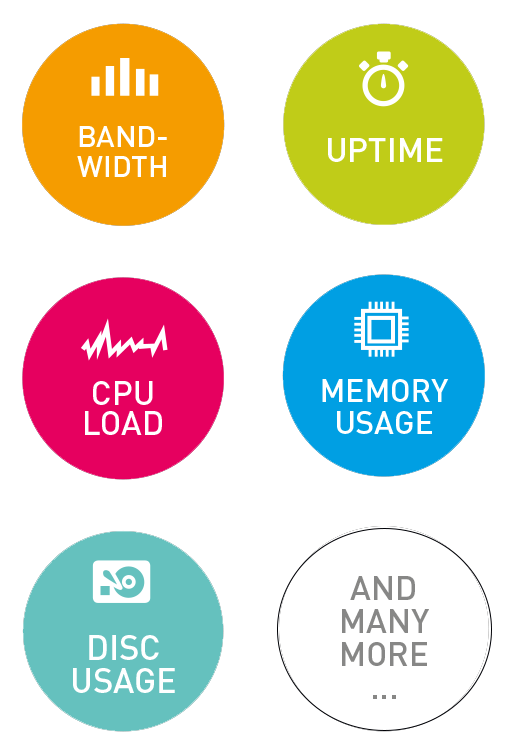
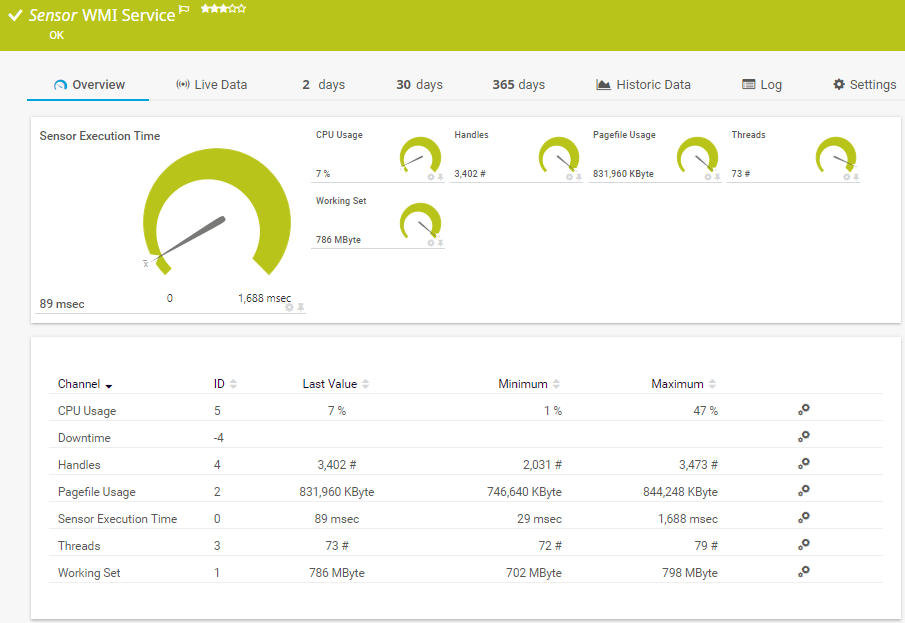
WMI is already built into Windows systems and runs as a Windows Management Instrumentation service. Administrators don’t have to worry about how to monitor the performance of servers or workstations: more often than not, they only need to enter their credentials to access the appropriate devices. Through WMI, you can collect information about the state of the Windows system: CPU usage, memory usage, traffic from the network card, and more.
But there is a drawback: WMI requires resources. It puts a lot of strain on the system. Therefore, when you scan Windows with PRTG, we recommend using no more than 200 WMI sensors per probe, and scanning at long intervals. While in a normal situation the standard interval is one minute, in the case of WMI monitoring, the interval should be increased to 5 minutes.
More options for Windows monitoring:
Option 1: As an alternative to WMI monitoring, administrators can use SNMP. SNMP allows you to collect values for parameters such as availability, CPU utilization, memory, and NIC status. SNMP is much less than WMI loads the system. However, in most cases, you need the SNMP service installed on the devices and servers that you plan to monitor.
Option 2: Another alternative to WMI is hybrid sensors, which use Windows performance counters as the primary query method, and WMI as a fallback. Windows performance counters are more efficient than WMI. However, if counters are not available, WMI is used.
Traffic Monitoring: WMI Comparison, SNMP, Packet Analysis, NetFlow
| WMI | SNMP | Packet Analyzer | xFlow (IPFIX, NetFlow, sFlow, jFlow) | |
| Complexity of configuration | Average | Low | Low to complex (depending on the filtering rules used) | May be difficult (for example, you may need to configure a switch) |
| Ability to filter traffic | No | No | Yes | Yes |
| Differentiate bandwidth usage by protocol and IP address | No | No | Yes | Yes |
| PRTG can show ratings (activity rating, connections, protocols, user ratings) | No | No | Yes | Yes |
| Filter bandwidth usage by IP address | No | No | Yes | Yes |
| Bandwidth Filtering by MAC Addresses | No | No | Yes | No |
| Bandwidth Filtering by Physical Network Port | Yes | Yes | No | No |
| Monitor network settings other than bandwidth usage | Yes | Yes | No | No |
| CPU usage on a machine with PRTG |
Low |
Low | Higher, depending on the volume of traffic | Higher, depending on the volume of traffic |
| Bandwidth overload during monitoring |
Low |
Low | No (unless switch ports are used for monitoring) | Depending on traffic |
Quick start with PRTG: more than 10 ready-made sensors for WMI monitoring
PRTG provides a wide range of sensors for WMI monitoring. And you can quickly, in a few clicks, create your own WMI sensors.
Examples of ready-made sensors:
- Windows System Uptime Sensor: Windows System Uptime Sensor monitors the uptime of Windows-based devices on your network via WMI
- Windows CPU Load Sensor: Windows CPU Load Sensor monitors cpu usage on your computer via WMI
- WMI File Sensor: With WMI File Sensor, you can monitor the status of files on your Windows server and workstations
- WMI Free Disk Space (Multi Disk) Sensor: This sensor monitors free disk space
- Microsoft SQL Server 2016 Sensor WMI: Microsoft SQL Server 2016 Sensor WMI allows you to monitor SQL database performance (SQL 2008, 2012, and 2014)
- Windows Network Card Sensor: Use this sensor to monitor the amount of traffic, bandwidth of the Windows network card
- WMI SharePoint Process Sensor: This sensor monitors the Microsoft SharePoint server
- WMI Security Center Sensor: With WMI Security Center Sensor, it is possible to monitor all security protocols that Windows Security Center uses
- Performance Counter Sensor: This sensor collects data from Windows performance counters that you configure yourself
- WMI Custom Sensor: With WMI Custom Sensor, you can create your own WMI sensors with a customizable WQL query