Think-cell
 Best Tools for Creating Professional Presentations in Microsoft PowerPoint
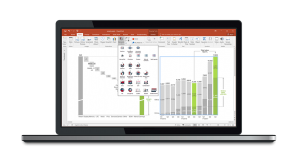
A special extension think-cell for the program for creating presentations MS Power Point using MS Excel is designed to quickly create presentations in a business style. The extension contains dozens of standard patterns of graphs, diagrams and diagrams for visualizing complex data structure. With this extension, you build your objects based on data that can be edited in quick mode.
Think-Cell Chart.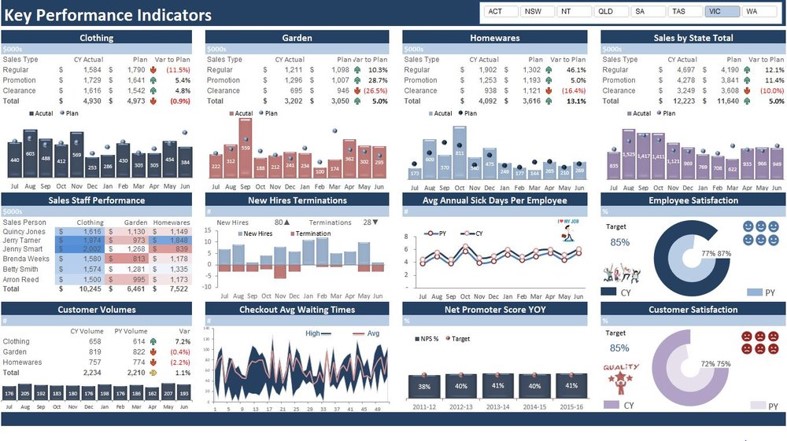
Powerful charting and graphing software. It has extensive and unique functionality, and also allows you to develop projects taking into account the corporate design of the company. Minimum routine – maximum efficiency. Easily create accurate, thoughtful, and easy-to-read charts.
Think-cell Chart easily integrates with PowerPoint and can be customized to any design standard.
Advantages of Think-cell Chart
| Convenience | Compatibility | Consistency |
|
Think-cell Chart offers a simple interface without many menus, panels, lists and windows – instead, all functions that are understandable even to a novice user are available directly through the manipulation of objects. In addition, the employee can use all the usual powerpoint and Excel tools |
Think-cell Chart is easily integrated into the user’s work environment. The application is fully compatible with PowerPoint and Excel file formats. All graphs are created by combining PowerPoint forms and Microsoft Graph graphs, always remaining editable |
When visualizing Excel data in PowerPoint, you often need to add additional logos, lines, and other graphics to your presentation—their location depends on how the data is displayed. However, when modifying data, the structure can change uncontrollably. in this case think-cell chart maintains binding to excel tables to ensure that other chart elements move correctly when the data is refreshed |
| Efficiency | Interaction | Quality |
| Thanks to Think-cell Chart, even novice users can edit graphs in PowerPoint 3-5 times faster than usual. | Think-cell Chart allows employees to collaborate to create chart slides designed to the organization’s standards |
Think-cell Chart allows you to create professional slides with charts that are instantly available for use in presentations |
Main features:
- A column chart and a stacked bar chart. Bar charts seem simple at first glance, but creating labels, axis breaks, and additional improvements can be time-consuming. Think-Cell Chart will help to significantly speed up the creation of a chart of any complexity.
- Cascading diagram of deviations (waterfall). To create such a chart, simply enter the desired values in the cells. The program automatically converts them into a diagram showing the exact dynamics of any process. Easily calculate subtotals, use segment connectors to change the order of summation.
- Gantt chart. Think-Cell allows you to create complex time charts (also known as Gantt charts) directly in PowerPoint. Create easy-to-read charts with labels that are based entirely on calendar data, for example.
- Diagram of Mekko. Mecco charts (also known as Marimecco charts) use variable column widths and heights to display data. Data entry is similar to a chart in which data is represented as absolute values or percentages of a given total.
- Technological diagram. Use a flexible and convenient tool to create technology diagrams. Simply insert basic elements (shapes, comments, etc.) onto a slide and combine them to create complex layouts.
- Agenda. With Think-Cell, creating an agenda in PowerPoint is as easy as a headline in your favorite text editor.
- Powerful presentation tools. Think-Cell provides many convenient tools with which you can effortlessly create composite, easy-to-understand and neat diagrams.
- Data references. Think-Cell uses a built-in Excel-based spreadsheet to make data references as easy as possible.
- Extract data from chart images. With Think-Cell, you can retrieve numeric data and category labels from any column image or histogram. The program recognizes not only simple column and histograms, but also compound diagrams.
- Rounding values. When data is compiled for a report or PowerPoint presentation, rounding summation in Excel is a frequent and most frustrating problem. Think-Cell will round everything exactly as it should.
- Common features: corporate design (CD), support for co-authoring for Sharepoint, perform actions with one click, “lasso” for quick selection of necessary elements, full-fledged PowerPoint signatures, multilingual interface.
Where to buy? For purchase inquiries ask us